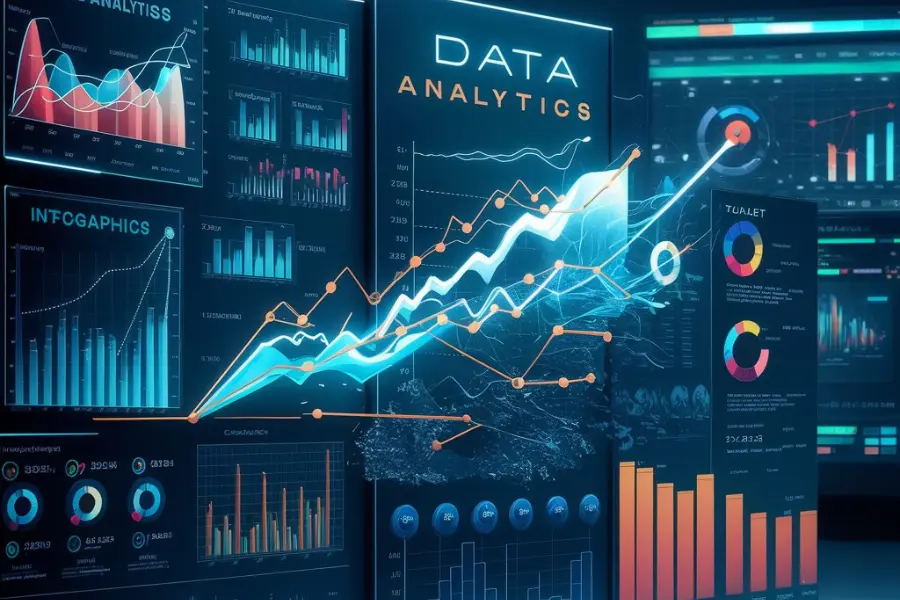
Visual Analytics: Turning Complex Data into Actionable Insights
In today's data-driven world, organisations are inundated with vast amounts of data from various sources. The challenge is not the availability of data but the ability to interpret and derive actionable insights from it. This is where visual analytics steps in, transforming complex datasets into clear, understandable visuals that facilitate informed decision-making.

Understanding Visual Analytics
Visual analytics is the science of analytical reasoning supported by interactive visual interfaces. It combines automated analysis techniques with interactive visualisations for effective understanding, reasoning, and decision-making. By integrating computational algorithms, data mining, and visualisation, visual analytics helps users gain insights that would be difficult to discern from raw data alone.
The Power of Visualization
Human brains are wired to process visual information efficiently. According to research, people can process visuals 60,000 times faster than text. Visual analytics leverages this innate capability by presenting data in charts, graphs, maps, and other visual formats, making it easier to identify patterns, trends, and outliers.
For example, a heat map can reveal areas of high activity or concern in geographic data, while a time series graph can show trends and seasonal patterns over time. These visual representations make complex data more accessible and understandable, enabling quicker and more accurate decisions.
Key Components of Visual Analytics
Data Integration
Visual analytics integrates data from diverse sources, providing a comprehensive view of the information landscape. This could include structured data from databases, unstructured data from social media, or real-time data from IoT devices.
Interactive Visualization
Users can interact with the visual representations, drilling down into details, filtering out noise, and zooming in on areas of interest. This interactivity fosters a deeper exploration of the data and encourages a more thorough analysis.
Analytical Techniques
Visual analytics employs advanced analytical techniques such as statistical analysis, machine learning, and data mining. These techniques automate the identification of patterns and correlations, making it easier for users to derive insights.
User Interface
A user-friendly interface is crucial for effective visual analytics. It should allow users to navigate through data intuitively, customise visualisations, and share insights easily.
Applications of Visual Analytics
Business Intelligence
Companies use visual analytics to track key performance indicators (KPIs), monitor sales trends, and analyse customer behaviour. This helps in making data-driven decisions that can enhance operational efficiency and profitability.
Healthcare
In healthcare, visual analytics can be used to monitor patient vitals, track disease outbreaks, and analyse treatment outcomes. This can lead to better patient care and more effective public health strategies.
Finance
Financial institutions leverage visual analytics to detect fraudulent activities, assess market risks, and analyse investment portfolios. The ability to quickly visualise complex financial data helps in mitigating risks and optimising investment strategies.
Public Safety
Law enforcement agencies use visual analytics to analyze crime data, predict hotspots, and allocate resources efficiently. This proactive approach can significantly improve public safety and crime prevention.
Benefits of Visual Analytics
Improved Decision-Making
By presenting data in an intuitive format, visual analytics helps decision-makers understand complex information quickly and make informed decisions.
Enhanced Insights
Visualisations reveal hidden patterns and correlations that might be missed in raw data, providing deeper insights into the data.
Increased Efficiency
Automating the analysis process and providing interactive visualisations saves time and resources, allowing analysts to focus on interpreting results and strategizing.
Better Communication
Visual analytics makes it easier to communicate findings and insights to stakeholders, fostering a data-driven culture within the organisation.
Visual analytics is revolutionising the way organisations interpret and act on data. By turning complex data into actionable insights through intuitive visual representations, it empowers businesses to make smarter, faster, and more informed decisions. As data continues to grow in volume and complexity, the importance of visual analytics will only increase, driving innovation and efficiency across various sectors.
Tired of drowning in data? Unleash the power of visualization! Data analytics Bootcamp teaches you how to transform complex data into stunning, insightful visuals. Learn to tell compelling stories with your data and drive better decisions. Enroll now and become a visual storytelling master!
Active Events
Maximizing Your Earnings: 7 Strategies for Business Analysts in 2024
Date: Aug 07, 2025 | 7:00 PM (IST)
7:00 PM (IST) - 8:10 PM (IST)
2753 people have registered
Navigating the World of SERP Features: Tips, Tricks, and Strategies
Date: Aug 07, 2025 | 7:00 PM(IST)
7:00 PM(IST) - 8:10 PM(IST)
2811 people have registered
Bootcamps
Digital Marketing Bootcamp
- Duration:8 weeks
- Start Date:October 5, 2024
Data Science Bootcamp
- Duration:8 weeks
- Start Date:October 5, 2024
