How Can Data Visualization Enhance Your Data Analytics Projects?
Updated on 20th July, 2024
190k views

10 min Read
Introduction
share
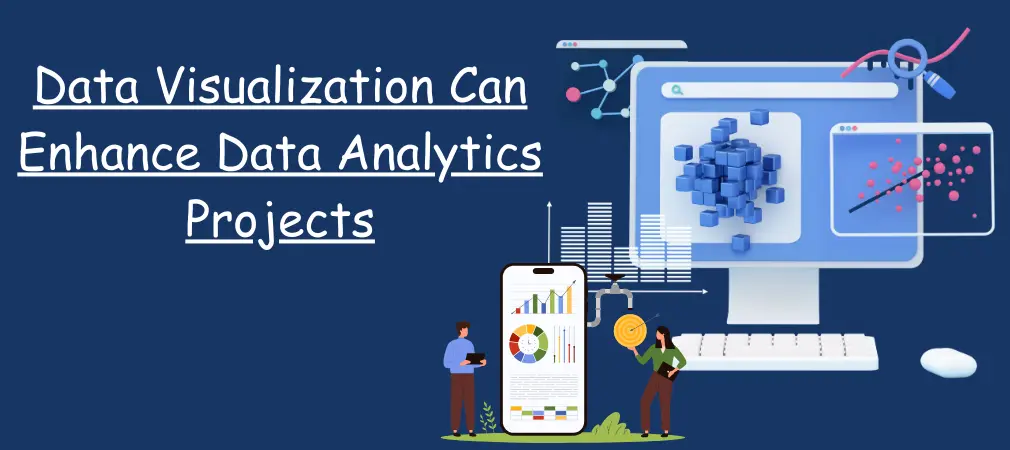
In today's data-driven world, the ability to interpret and communicate data effectively is crucial for decision-making and strategic planning. Data visualization plays a pivotal role in this process, transforming complex data sets into visually compelling and easily understandable formats. Whether you're a data scientist, business analyst, or executive, data visualization can significantly enhance your data analytics projects. This article delves into the various ways data visualization can elevate your analytics efforts, the tools and techniques involved, and best practices for creating impactful visualizations.
The Power of Data Visualization
Data visualization involves the use of graphical representations such as charts, graphs, maps, and dashboards to present data. It is a powerful tool that helps in uncovering patterns, trends, and insights that might be overlooked in raw data. Here are several key ways in which data visualization enhances data analytics projects:
1. Simplifies Complex Data
One of the primary benefits of data visualization is its ability to simplify complex data sets. Large volumes of data can be overwhelming and difficult to interpret when presented in spreadsheets or raw formats. Visual representations like bar charts, line graphs, and scatter plots make it easier to grasp large and complex data at a glance.
For instance, a company analysing sales performance across different regions can use a heatmap to quickly identify areas with high and low sales, making it easier to focus on specific regions that need attention.
2. Identifies Trends and Patterns
Visualising data helps in identifying trends, patterns, and outliers that may not be immediately apparent in tabular data. Time-series data, for example, can be effectively visualised using line graphs to show trends over time, helping businesses to understand seasonal variations, growth patterns, and potential anomalies.
For example, an e-commerce platform can use line graphs to track website traffic and sales over time, identifying peak shopping periods and adjusting marketing strategies accordingly.
3. Enhances Data Storytelling
Data storytelling is the practice of building a narrative around data, making it more relatable and understandable to a wider audience. Data visualization is a critical component of effective data storytelling, enabling analysts to create compelling stories that highlight key insights and drive action.
For instance, a nonprofit organisation can use a combination of charts and infographics to tell a story about the impact of their programs, highlighting key metrics and success stories to stakeholders and donors.
4. Facilitates Quick Decision-Making
In a fast-paced business environment, quick and informed decision-making is essential. Data visualization provides real-time insights that enable stakeholders to make timely decisions. Dashboards, for example, offer a consolidated view of key performance indicators (KPIs), allowing executives to monitor business performance and make data-driven decisions quickly.
For instance, a financial institution can use a real-time dashboard to monitor market trends and portfolio performance, enabling portfolio managers to make quick investment decisions.
5. Improves Data Accessibility
Data visualization makes data more accessible to non-technical stakeholders. While data scientists and analysts may be comfortable with raw data and statistical analyses, other team members may find it challenging to interpret these formats. Visualisations bridge this gap, making data understandable and actionable for everyone in the organisation.
For example, a human resources department can use pie charts and bar graphs to present employee demographics and survey results, making it easier for managers to understand and address workforce issues.
Tools and Techniques for Data Visualization
There are numerous tools and techniques available for creating effective data visualizations. The choice of tool and technique depends on the nature of the data, the audience, and the specific insights you wish to convey. Here are some popular tools and techniques used in data visualization:
Tools
1. Tableau: Tableau is a powerful data visualization tool that allows users to create interactive and shareable dashboards. It supports a wide range of data sources and offers advanced analytics features.
2. Power BI: Microsoft Power BI is a business analytics tool that provides interactive visualizations and business intelligence capabilities. It integrates seamlessly with other Microsoft products and supports real-time data analysis.
3. D3.js: D3.js is a JavaScript library for creating dynamic and interactive data visualizations in web browsers. It is highly customizable and is used for creating complex and tailored visualizations.
4. Google Data Studio: Google Data Studio is a free tool that allows users to create interactive reports and dashboards. It integrates with various Google products and data sources.
5. Plotly: Plotly is a graphing library that supports interactive plotting. It is available for Python, R, and JavaScript, making it a versatile choice for data visualization.
Techniques
1. Charts and Graphs: Basic charts and graphs such as bar charts, line graphs, pie charts, and scatter plots are fundamental to data visualization. They are effective for comparing values, showing trends, and illustrating distributions.
2. Heatmaps: Heatmaps use colour coding to represent data density or intensity. They are particularly useful for showing geographic data or identifying concentrations of activity.
3. Dashboards: Dashboards consolidate multiple visualizations into a single interface, providing a comprehensive view of key metrics and performance indicators. They are often used for real-time monitoring and decision-making.
4. Infographics: Infographics combine text, images, and data visualizations to tell a story or explain a concept. They are effective for presenting complex information in an engaging and easily digestible format.
5. Geospatial Visualisations: Maps and geospatial visualizations are used to represent data with a geographic component. They are useful for analysing spatial patterns and trends.
1. Know Your Audience
Understanding your audience is crucial for creating effective visualizations. Consider the level of data literacy, the context in which the data will be used, and the specific insights that are most relevant to your audience. Tailor your visualizations to meet their needs and preferences.
2. Choose the Right Visualisation Type
Select the appropriate visualization type based on the nature of your data and the insights you want to convey. Different types of visualizations are suited for different purposes, such as comparison, distribution, composition, and relationship. Avoid using complex or inappropriate visualizations that may confuse your audience.
3. Keep It Simple
Simplicity is key to effective data visualization. Avoid clutter and unnecessary elements that can distract from the main message. Use clear and concise labels, legends, and annotations to ensure that your visualizations are easy to understand.
4. Use Colour Wisely
Colour can enhance the readability and impact of your visualizations, but it must be used wisely. Choose a colour palette that is visually appealing and accessible to people with colour vision deficiencies. Use colour to highlight important data points and create visual contrast, but avoid overuse of bright or clashing colours.
5. Ensure Accuracy
Ensure that your visualizations accurately represent the data. Avoid misleading representations, such as distorted axes or inappropriate scales that can misinform your audience. Always double-check your data and visualizations for accuracy and consistency.
Conclusion
Data visualization is an indispensable tool in the arsenal of any data-driven organisation. It transforms raw data into meaningful insights, simplifies complex information, and enables effective communication across diverse audiences. By leveraging the right tools and techniques, and adhering to best practices, you can elevate your data analytics projects and drive informed decision-making. Are you ready to harness the power of data visualization for your data analytics projects? Start by understanding your audience, choosing the right visualization types, and following best practices to create impactful visualizations. Invest in powerful tools like Tableau, Power BI, or Google Data Studio to enhance your capabilities. Begin your journey today and unlock the full potential of your data. Contact us to learn more about how we can help you master data visualization and drive your business forward.
Bootcamps
Bestseller
Data Analyst Course
Start Date :Aug 09, 2025
Duration :4 Months
Bestseller
Digital Marketing Course
Start Date :Aug 09, 2025
Duration :4 Months
Suggested Blogs
16 Success Tips to Build a Job-Ready Data Analyst Portfolio
Updated on 21th July, 2024

190k views

10 min Read
Enhance Decision-Making with Data Visualization
Updated on 20th July, 2024

111k views

10 min Read
Mastering Python, SQL, Sci-Kit-Learn, PyTorch, and Google Cloud in 5 Simple Steps
Updated on 21th July, 2024

190k views

10 min Read
More Blogs
© 2025 LEJHRO. All Rights Reserved.

